Rooftop vs utility solar: what Lazard, IRENA and BCG say
Published
Written and fact-checked by the RayValue team · How we research · Sources
On this page
You will often read two things that sound like they cannot both be true. Analysts say solar is among the cheapest ways to make new electricity. Yet a rooftop system on a house costs real money and takes years to pay back. This post sorts out the difference using published figures from Lazard, IRENA, BCG and the U.S. Energy Information Administration (EIA).
Key takeaways
- Large utility-scale solar is cheap per kilowatt-hour to produce. Small rooftop systems cost more per kilowatt-hour to produce.
- A homeowner does not compare a rooftop system to a power plant. They compare it to the retail price on their bill, which includes wires, poles and other costs on top of generation.
- Retail prices differ a lot by state, so the same rooftop system can look very different in Florida and California.
- Global cost figures are context, not a forecast of your payback. Use your own bill and quotes.
What a levelized cost number means
Analysts compare power sources with the levelized cost of energy (LCOE): the lifetime cost of building and running a generator, divided by the electricity it produces, expressed per megawatt-hour ($/MWh) or per kilowatt-hour. Dividing $/MWh by 10 gives cents per kilowatt-hour. LCOE is a useful yardstick, but it is not a bill. It leaves out delivery and it rests on assumptions about financing, sunshine and system life.
Utility-scale solar: cheap to generate
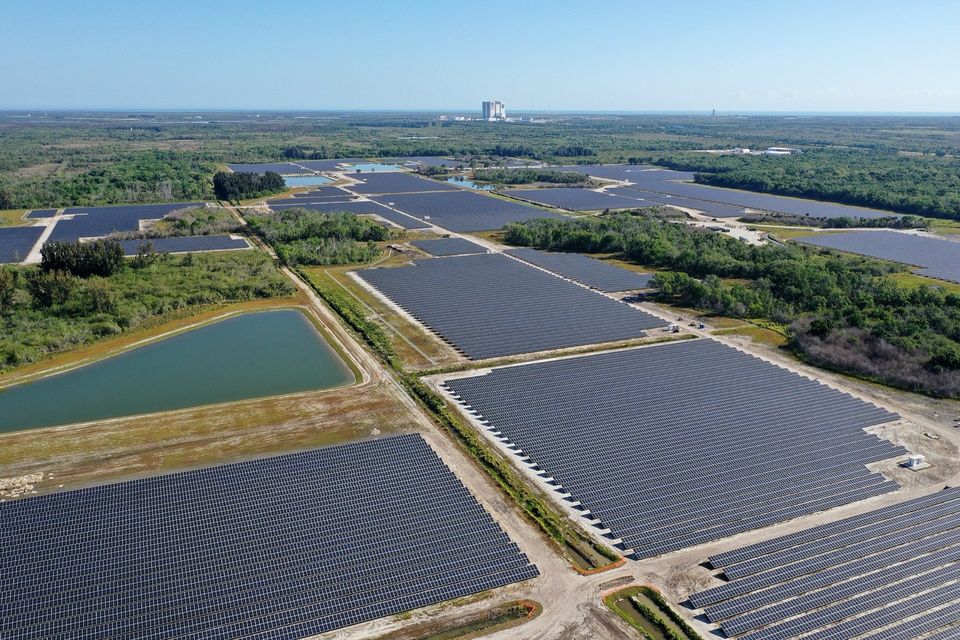
Lazard’s 2026 Levelized Cost of Energy+ report (July 2026) puts unsubsidized utility-scale solar at $40 to $98 per MWh, or roughly 4 to 10 cents per kilowatt-hour. Lazard says unsubsidized renewables remain the most cost-competitive new-build generation, though higher capital costs, sustained interest rates, tariffs and supply chain repricing have pushed LCOEs up year over year. In Lazard’s assumptions, utility-scale solar costs $1,250 to $1,850 per kilowatt to build and runs at a 20% to 30% capacity factor.
The global picture agrees. IRENA reports that new utility-scale solar worldwide averaged USD 0.043 per kilowatt-hour in 2024, about 90% below the 2010 average of USD 0.417, with total installed costs falling from USD 5,283 to USD 691 per kilowatt over the same period. IRENA also notes that the global weighted-average solar PV LCOE ticked up 0.6% in 2024 and that US and EU solar LCOE rose, which it ties to permitting delays, interconnection bottlenecks and higher balance-of-system costs. The long decline has flattened, and local conditions matter.
Smaller systems cost more per kilowatt-hour
Lazard’s 2026 comparison does not include a separate rooftop-residential line. Its closest category is “community and commercial and industrial (C&I)” solar, which Lazard models at roughly 1 to 5.5 MW per project. That is hundreds of times larger than a home system of about 5 to 10 kW, so it is a loose proxy at best. The figures:
| Lazard 2026, unsubsidized | LCOE ($/MWh) | Approx. cents per kWh | Capital cost ($/kW) | Capacity factor |
|---|---|---|---|---|
| Utility-scale solar | $40 to $98 | 4 to 10 | $1,250 to $1,850 | 20% to 30% |
| Community and C&I solar | $88 to $197 | 9 to 20 | $1,750 to $2,950 | 15% to 20% |
Smaller projects spread equipment, labor, permitting and sales costs over fewer panels, and they often face less ideal siting than a large field. We expect an individual house to cost more per kilowatt than these projects, but that is our reasoning, not a Lazard number, and it means the C&I range likely understates home costs. For real home prices, see residential solar prices in 2026.
Why rooftop can still pay: you avoid the retail price
Your rooftop system replaces electricity you would have bought at the retail price, which also covers delivery and other charges, while a utility-scale plant is paid for generation. Whether rooftop avoids some of those charges depends on how your utility bills you. For context, BCG notes in its September 2025 outlook that grid charges, levies and taxes make up more than half of residential electricity bills in many countries; that is not a U.S. or state figure.
These figures come from EIA’s 2024 average monthly bill table (Table 5A, released October 7, 2025), which pairs price with usage and bill. They are 2024 figures; for newer prices alone, EIA’s Electric Power Annual Table 2.10 puts Florida’s 2025 residential average at 15.21 cents (see Florida electricity rates in 2026). The 2024 table shows how wide the retail gap was across our two states:
| 2024 average residential price (EIA) | Cents per kWh | Average monthly bill |
|---|---|---|
| Florida | 14.14 | $156.09 |
| California | 31.97 | $160.86 |
| U.S. average | 16.48 | $142.26 |
Putting the two tables side by side (2026 LCOE, 2024 retail prices) is a rough comparison only, since an LCOE and a retail price measure different things and your actual financing and system will differ. Still, the pattern is useful. Florida’s retail average of about 14 cents sits inside the C&I range of roughly 9 to 20 cents, but because home systems likely cost more per kilowatt than the larger projects behind that range, the answer depends heavily on your system price and usage. California’s average of about 32 cents is above the top of that range, which is part of why rooftop solar can look attractive there. Exported power is credited under different rules than the retail rate, so what matters is how much solar you use at home and how exports are credited. See California NEM 3.0 and batteries.
What BCG adds: demand, not just cost
BCG’s September 2024 piece argues that the energy transition depends on building products customers actually want, and credits the rooftop solar success in Gujarat, India mainly to meeting consumer needs rather than to subsidy. BCG does not make claims about U.S. homeowners. Our own reasoning, not BCG’s, is that a homeowner’s decision rests on local policies and prices, not on global generation costs alone.
What this means for a Florida or California homeowner
- The cheapest solar electricity in the world is not available at your meter. What matters is your rooftop price against your retail rate and metering rules.
- With the federal residential credit gone for 2026 installs, the upfront price is the main driver. Compare it with the savings your bill would show.
- Rates, installed prices and rules change. Treat any payback figure as a range.
Next steps
- Run the Florida calculator or California calculator with your own bill to get a low, likely and high range.
- Read how we build the numbers on the methodology page.
- Check your utility: FPL, Duke Energy Florida, TECO, PG&E, SCE or SDG&E.
- When you are ready, compare quotes and use our guide on how to compare solar quotes.
Sources
- Lazard: Levelized Cost of Energy+ (2026 edition, July 2026), report PDF
- IRENA: Renewable Power Generation Costs in 2024, summary (July 2025)
- BCG: The Energy Transition's Next Chapter (September 11, 2025)
- BCG: Turbocharging the Energy Transition by Boosting Customer Demand (September 3, 2024)
- EIA: Average Monthly Bill, Residential, data for 2024 (Table 5A, released October 7, 2025)
- EIA: Electric Power Annual, Table 2.10 Average Price of Electricity to Ultimate Customers by End-Use Sector, by State