Florida summer bills: how solar and net metering help
Published
Written and fact-checked by the RayValue team · How we research · Sources
On this page
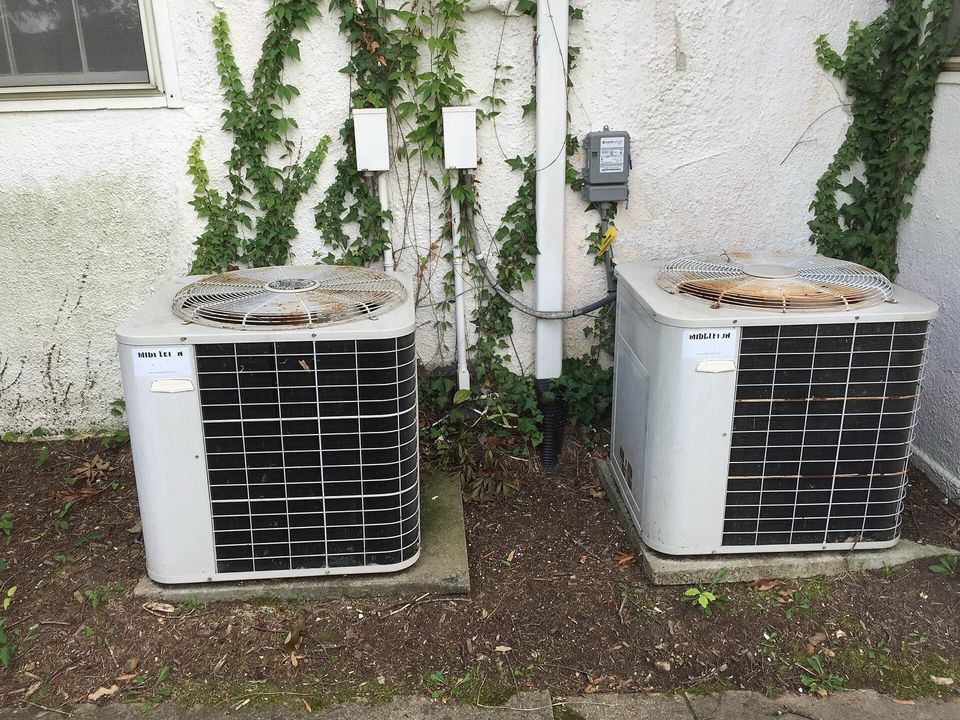
If your Florida electric bill jumps every summer, you are in good company. The cause is mostly one machine, and it also explains why a solar system’s savings do not simply track its output month by month. This post covers where the summer load comes from, how solar production changes through the year, and how net metering smooths the two together.
Key takeaways
- Air conditioning was about 30% of electricity use in the average Florida home in 2020 survey data, versus about 18% in California and about 19% nationally.
- In PVWatts modeling for Miami, Orlando and Jacksonville, solar output is fairly even through the year: summer months produce a bit more than winter months, but each city’s best month falls in spring.
- FPL’s net metering carries extra solar kilowatt-hours forward in an energy bank, so spring surplus can help cover summer shortfalls. Check Duke Energy Florida and TECO terms for your own utility.
- Your own numbers depend on your home, roof and utility. The Florida calculator gives a range, not a promise.
Why summer bills are high
The U.S. Energy Information Administration (EIA) runs the Residential Energy Consumption Survey (RECS), which estimates what households use electricity for. In the 2020 survey, Florida homes used about 115.4 trillion Btu of electricity for air conditioning, out of about 384.8 trillion Btu of electricity for all uses. That works out to roughly 30% (our arithmetic from EIA’s two state tables). Add the electricity used by the air handlers that move cooled air and the cooling-related share rises to roughly 35%.
For comparison, the same tables put California air conditioning at about 18% of home electricity (53.6 of 291.5 trillion Btu) and the national figure at about 19% (866.1 of 4,453.3 trillion Btu). Florida is considerably more cooling-heavy than the rest of the country.
Two other facts from the same data help explain the picture:
- Florida homes ran almost entirely on electricity in 2020. EIA’s table shows electricity at 94% of household site energy in the state, so very few homes have a gas furnace taking the winter load (EIA’s table shows natural gas at about 5% of household site energy).
- The average Florida household used about 14,000 kWh of electricity in 2020, according to EIA’s per-household figure.
EIA has also noted, in a national article using 2015 survey data, that monthly home electricity use typically peaks in July and August when cooling demand is highest. That is a national statement, not a Florida monthly chart. For your own home, the clearest evidence is your last twelve monthly bills.
How solar output moves through the year
Solar production does not mirror the air-conditioning load. To see the pattern, we ran the NLR PVWatts v8 model (NLR is the National Laboratory of the Rockies, formerly NREL) for three Florida cities in October 2026. The inputs were a 1 kW system, fixed roof-style mount, 20 degree tilt, facing south, with system losses set to a fixed 14% (we chose this value, since the API requires one; PVWatts losses can otherwise vary with the shade level selected, so these runs did not vary it). Weather data came from the NSRDB tmy-2020 dataset. The locations used were latitude/longitude 25.76, -80.19 (Miami), 28.54, -81.38 (Orlando) and 30.33, -81.66 (Jacksonville), with array type 1 (Fixed - Roof Mounted in the API) and azimuth 180. These are modeled typical-year values, not forecasts for any specific roof.
| City | Lowest month | Highest month | June to August share of annual output |
|---|---|---|---|
| Miami | 110 kWh (December) | 152 kWh (March) | about 26% |
| Orlando | 106 kWh (December) | 153 kWh (May) | about 26% |
| Jacksonville | 92 kWh (December) | 146 kWh (May) | about 27% |
Annual output per kilowatt in the same runs was about 1,552 kWh in Miami, 1,544 kWh in Orlando and 1,455 kWh in Jacksonville. If output were perfectly flat, June to August would be 25% of the year, so the summer share is close to flat. In these runs, each city’s single best month falls in spring (March or May), not in June to August.
The takeaway is that December is the weak month for solar, and summer is merely solid. Your air conditioner, meanwhile, works hardest in summer. Production and load are mismatched by season, but not as badly as you might guess from the heat alone.
Where net metering helps
Under FPL’s net metering, your solar output first serves your home, and FPL’s FAQ says any excess is added to your energy bank for future use. We did not verify the equivalent terms for Duke Energy Florida or TECO for this post, so check your own utility’s tariff at the utility pages linked at the end.
In practice this means a bright, mild April or May can build up kilowatt-hours that you then spend during a high-usage July or August. The credits are in kWh, not dollars, so the swap happens at your utility’s rates when you use them.
Some limits to keep in mind:
- FPL’s FAQ describes a $30 minimum base bill that applies to all customers, so a bill of zero is not the goal. Other utilities have their own rules.
- Credits left over at year end are valued differently. Unused kWh at the December reading are credited on your December bill at FPL’s average annual cost of generation (a bill credit, not a cash payment; FPL net metering FAQ). The RayValue calculator takes the conservative route and counts leftover credits as worth nothing (see our methodology).
- Winter is the reverse problem: a December with less sun may leave you buying some grid power, though Florida heating loads are small (EIA data above puts electric space heating at under 8% of home electricity).
An illustrative sizing example
This example is illustrative, not typical for your home. EIA’s average Florida household used about 14,000 kWh in 2020. At roughly 1,544 kWh per kilowatt per year (the Orlando PVWatts run above), covering all of it would take about 14,000 / 1,544, or roughly 9 kW of panels. Many homes use less, have shaded or poorly oriented roofs, or choose a smaller system, so your number could be well below or above that.
The practical point: because net metering moves surplus across months, you size against your annual use, not your summer peak. That is also why a system that looks small compared with your July bill can still meet most of your yearly consumption.
What to do next
- Pull your last twelve months of kWh from your utility account. The summer-to-winter gap tells you how cooling-driven your home is.
- Run the Florida calculator with that annual use to see a low, likely and high range for system size, cost and payback.
- Read how your utility treats exported energy: FPL, Duke Energy Florida or TECO.
- Remember that the federal residential credit no longer applies to 2026 installs, so quotes should be compared on their own price and production assumptions. See our guide to Florida solar without the federal credit and our guide to comparing quotes.
- If you want installer quotes, you can request them at /quotes. Compare production estimates against the monthly pattern above.
Related reading: Florida electricity rates in 2026.
Sources
- EIA RECS 2020, Table CE5.1.ST: household site electricity end-use consumption by state
- EIA RECS 2020, Table CE2.1.ST: household site fuel consumption by state
- EIA Today in Energy: Air conditioning and other appliances increase residential electricity use in the summer (May 2017)
- NLR PVWatts v8 API (NSRDB tmy-2020 weather data), monthly output queries run October 2026; parameters listed in the post
- FPL: Net metering FAQ